07Sep

20 Top Signals From Google Analytics

google-analytics-name2-1920

In 2017, data drives every aspect of business. From predictive analytics powered by artificial intelligence, to data-based operating systems that allow businesses to perform just about any task with an immediate backdrop of company data, businesses are growing increasingly savvy about how to use data to guide their every step.

The story is no different in the realm of marketing. The most effective marketing decisions are data-driven these days, based on which tactics garner the most traffic, the most engagement, or the most conversions. And where does most of that marketing data come from? Google analytics.

Everyone knows that you can get website traffic information from google analytics, but what many people don’t know is just how much it allows them to drill down into the details of that data, and how they can use that nitty-gritty to inform every marketing decision they make. Here are just 20 of the things that Google Analytics can do – and how you can use them to your advantage.

1. Data from other sources.

Wondering where your social media stats fit into the big picture presented by Google Analytics? Need one central dashboard with all your marketing data in one place? Google Analytics has a Data Import function that allows you to combine data from other sources with the data it provides, thus giving you a complete picture of the results of your online marketing efforts – vital information in order for you to make educated decisions about your strategy.

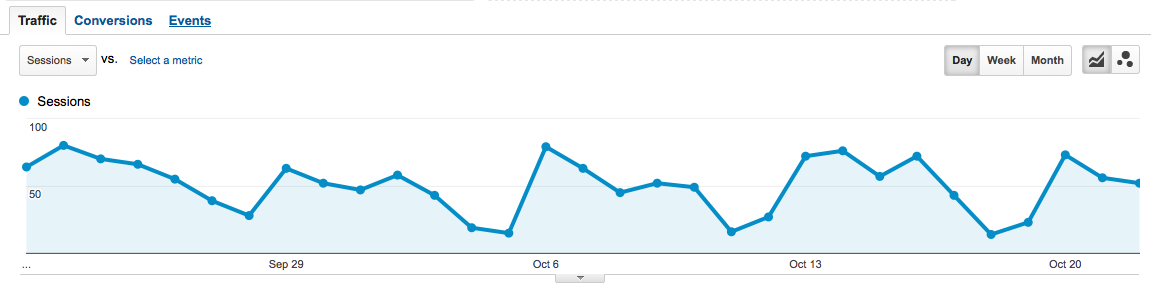
2. Show real-time traffic data.

How many people are on your site right now? Log in to Google analytics and you can watch visitors come and go in real-time on your computer screen. What pages are they on? Where are they lingering, and when do they leave? It can be extremely informative – not to mention exciting – to watch your traffic in real-time.

3. Find the geographic locations your visitors come from.

Whether you’re targeting an international audience or just your own hometown, GA can show you where your marketing activities are having an impact. It allows you to see both the countries and the cities where your visitors are located. You might be surprised to learn that your marketing message is resonating with people in unexpected locations – and you can use that information to tweak your tactics accordingly.

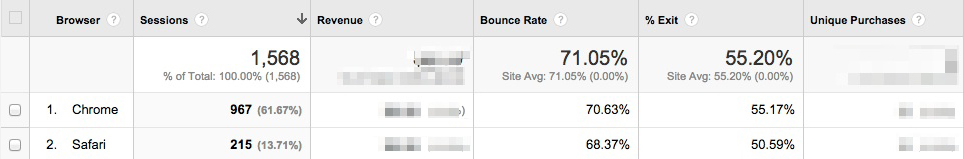
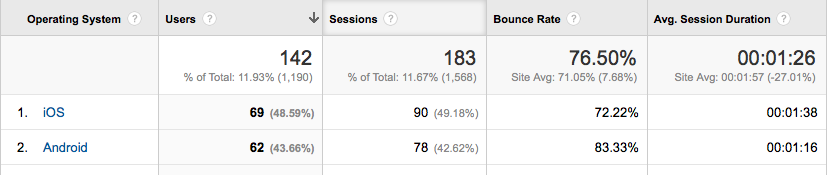
4. See which devices your visitors are using.

Google Analytics allows you to see whether your visitors are primarily mobile or computer-based – which gives you insight into how important it is for you to have a mobile-friendly site. But more than that, GA lets you know what types of devices they’re using, right down to the brand and operating systems, so you can check your site’s performance on each one and make sure it’s optimized for all of your visitors.

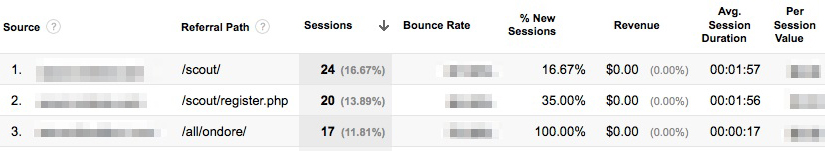
5. Show the channels your traffic is coming from.

If you’re wondering whether your marketing tactics have been more successful with search engines or on social media, Google analytics will show you exactly which channels are sending you traffic, and how much of it you’re getting from each one. You may want to focus more intensely on certain channels once you see their ROI, and tweak your tactics on others to make them more effective.

6. Watch the path visitors take through your site.

By clicking on ‘Behavior Flow’ in GA, you’ll be able to see each step a visitor takes when they visit your site, from the page that brought them in, to the ones they visited next, and finally, which one made them leave. This data is invaluable, giving you insight into what attracts your traffic, what holds their interest, and which pages you still need to work on to make them just as interesting.

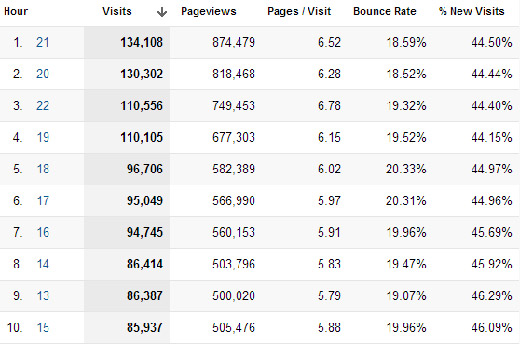
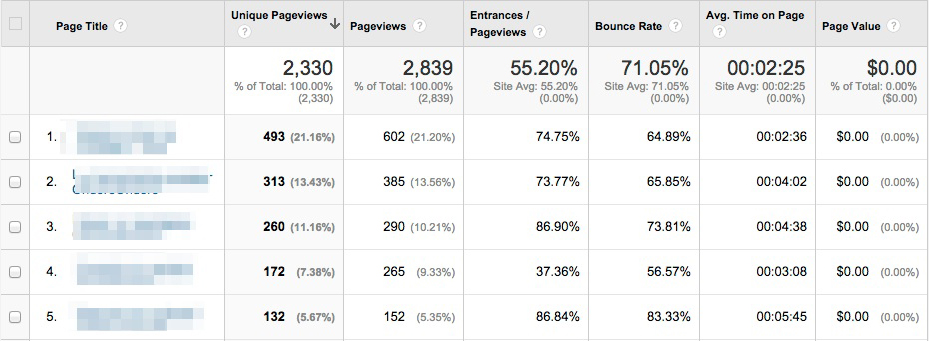
7. Rank pages by popularity.

You can also check to see the top, most often visited pages on your site – whether you want to know which pages are your all-time best performers, or which ones did the best last month. This data gives you a deeper understanding of what type of content does well with your audience, and what falls flat. Maybe seasonal blog posts draw a ton of traffic, but informational pages don’t – or vice versa. The numbers practically write your content strategy for you.

8. Track your e-commerce performance.

This one require a little legwork on your part first, as you’ll have to set up e-commerce tracking manually within GA – but once you do, Google analytics will keep tabs on sales activity on your site, from which products are your best sellers to the times they were purchased and whether they were eventually returned and refunded.

9. Watch your conversion rates for other goals.

Once again, you’ll need to set this up manually within GA, but once you set your goals, Google Analytics will track how many visitors are converting. You can have multiple goals, from filling out a Contact Us form to signing up for an email newsletter, and GA will show you just how effective your content, design, and calls to action are.

10. Track clicks on your site.

Google analytics will actually track every single click on clickable parts of your site’s pages, so that you can see what’s working to attract clicks, and what’s not – and tweak accordingly.

11. Segment your traffic for more insight.

You can also segment your traffic within Google analytic s, dividing it up based on traffic source, whether they converted or not, and much more. By doing this, you get a much more granular view of which groups are doing what, and which pages on your site are working – or not working – with each group.

12. View the interests of your visitors.

While you can’t personally track individual visitors with Google Analytics, you can still find out a lot about each one. Their interests, for example, and even their professions. This data can also be invaluable in determining how to tweak your marketing approach to appeal to them most effectively.

13. Check the results of your longer-term marketing campaigns.

Whether it’s a paid Ad Words campaign or an organic social media blitz, you can track your results in Google Analytics easily. You’ll just have to add a tracking code to the end of the URL you’re sending visitors to, and then GA will be able to show you how well you’re doing by tracking traffic to that URL.

14. Check the results of quick, one-day campaigns.

With GA’s real-time traffic tracking, you can watch the performance of even short marketing campaigns in order to find out what works and what doesn’t. This can guide your future short campaigns, or inform your strategy for longer campaigns.

15. Watch the real-time effects of social sharing.

Did you just post a new blog post to Facebook? Or ask people to visit your landing page on Twitter? Once again, GA’s real-time view of traffic will allow you to watch as people begin to engage with your content, and help you determine what works and what doesn’t.

16. Test site changes in real-time.

And one more real-time benefit? You can make changes to your site, and then track exactly how they’re affecting your traffic’s behavior in real-time. Are they leading to more conversions, or fewer? Are they guiding visitors through the sales funnel, or are they causing a higher bounce rate? The answers will tell you how to tweak your site.

17. Create your own channel groups for tracking traffic sources.

Google Analytics does offer its own channel categories for tracking the sources your traffic comes from, but you can also create your own unique groupings of channels to keep tabs on your visitors and which tactics are most effective at attracting them to your site.

18. How quickly your website loads.

Since site loading speed is part of Google’s ranking algorithm, this is an important thing to check from time to time. If Google Analytics tells you it’s taking longer than three seconds to load for your visitors, you’ll need to take steps to speed it up.

19. Track cart abandonment.

One of the most important things GA can do for e-commerce sites is help you determine the point when visitors are abandoning their carts. Is it at the shipping page? The payment page? Once you have this information, you can try offering discounts or free shipping or even just changing the flow of your check out process to see what gets more visitors to complete their purchases.

20. Track form abandonment.

If, for you, a conversion means filling out a form on your site, then GA can help you see which blanks are being filled in, and at what point your form is being abandoned. This can be invaluable in understanding how to change your form or your calls to action in order to get visitors to finish giving you their information.

Believe it or not, this is far from all that Google analytics can do. Start with these 20 things to give yourself a solid foundation in navigating GA, and then you’ll feel more confident exploring everything else it has to offer. And once you’ve got the hang of it, you’ll be amazed at just how much more effective your marketing becomes, now that it’s based on the detailed data Google analytics provides.

15Jun

How to increase your blog traffic?


The bad news is that it’s not quite that simple. Was Japan built in a day?  NO Then why to worry. It takes doing several things right—and doing them over a long period of time.

The good news is that it’s not rocket science. I have used several basic techniques to increase my blog traffic every year since I started tracking it in 2008 using Google Analytics. Some years have been better than others, but all have shown an increase:

Year Pageviews Increase
2008 574,778 N/A
2009 1,496,241 160.3%
2010 1,972,497 31.8%
2011 5,060,331 156.5%
2012 7,030,343 38.9%
2013 7,802,426 11.0%
2014 9,236,113 18.4%


I believe you can dramatically increase your blog traffic by following these ten strategies.

05May

Top 9 keyword research tools to find the right keywords

Here we’ll cover the nine best tools out there for performing keyword research for your website content. Before we get started though, let’s briefly go over two important things to consider as you do your research: relevance and (if applicable) location.

Keyword Relevance

Relevance is the most important factor to consider when choosing the right keywords for SEO. Why? Because the more specific you are, the better.

For instance, if you own a company that installs swimming pools, it’s likely that you’d attract more qualified prospects by targeting a keyword such as “fiberglass in-ground pool installation,” rather than “swimming pools.” That’s because there’s a good chance that someone searching for “fiberglass in-ground pool installation” is looking for information on installation or someone to perform the installation … and that could be you!

Sure, optimizing for “swimming pools” has its place. But there’s no doubt that this keyword will attract a much more generic audience that may not be looking for what you have to offer. Go for the relevant, long-tail keywords instead.

Location-Based Keywords

Another major factor to consider when optimizing for the right keywords is location-based searches. When looking for contractors and services in their specific area, search engine users will usually include their location in the search. So, “fiberglass in-ground pool installation” becomes “fiberglass in-ground pool installation in Boston, MA.”

If you operate in one geo-location, you may want to consider adding location-based keywords to all of your pages, since traffic from other locations isn’t going to be very much help to you. If your business operates in several geo-locations, it is also a wise choice to create a separate web page dedicated to each location so you can make sure your brand is present when people are searching for individual locations.

Now, how do you choose the right keywords for your business? We certainly don’t recommend guessing, for obvious reasons. Instead, there are many ways to research and find long-tail keywords that are right for your business.

Here are nine awesome free and paid keyword research tools you can use to quickly and easily identify strong long-tail keywords for your SEO campaign.

Free Keyword Research Tools

1) Google Keyword Planner

Google has a few tools that make it easy to conduct keyword research, and their free AdWords tool called Keyword Planner is a great place to start — especially if you use AdWords for some of your campaigns. (Note: You’ll need to set up an AdWords account to use Keyword Planner, but that doesn’t mean you have to create an ad.)

When you input one keyword, multiple keywords, or even your website address into Keyword Planner, Google will spit out a list of related keywords along with simple metrics to gauge how fierce the competition is around each one and how many searches it gets on both a global and local search level.

It’ll also show you historical statistics and information on how a list of keywords might perform — and it’ll create a new keyword list by multiplying several lists of keywords together. Since it’s a free AdWords tool, it can also help you choose competitive bids and budgets to use with your AdWords campaigns.

google-keywords-planner.png

Image Credit: Google

Unfortunately, when Google transitioned from Keyword Tool to Keyword Planner, they stripped out a lot of the more interesting functionality — but you can make up for it somewhat if you take the information you learn from Keyword Planner and use Google Trends to fill in some blanks.

Which brings me to the next tool …

2) Google Trends

Google Trends is another free tool from Google. It lets you enter multiple keywords and filter by location, search history, and category. Once you enter that information in, it’ll give you results that show how much web interest there is around a particular keyword, what caused the interest (e.g., press coverage), and where the traffic is coming from — along with similar keywords.

The best part about Google Trends is that it doesn’t just give you static keyword volume numbers like most keyword research tools. Instead, it generates colorful, interactive graphs that you can play with, download, and even embed on your website. It’ll also give you more dynamic insight into a keyword with information like relative popularity of a search term over time.

Interestingly, its data doesn’t include in repeated queries from a single user over a short period of time, which makes results cleaner. It also groups together searches that it infers to mean the same thing, like misspellings.

One way to use Google Trends? If you’re trying to decide between two keyword variations for your latest blog post title. Simply perform a quick comparison search in Google Trends to see which one is getting searched more often.

google-trends-compare-terms.png

3) Keyword Tool.io

Keyword Tool is pretty rudimentary online keyword research tool, but if you’re just looking for a list of long-tail keyword suggestions related to one you already have in mind, then it can be useful. It’s also totally free — to use the most basic version, you don’t even need to create an account.

What Keyword Tool does is use Google Autocomplete to generate a list of relevant long-tail keywords suggestions. The search terms suggested by Google Autocomplete are based on a few different factors, like how often users were searching for a particular term in the past.

keyword-tool-change-car-tire.png

This type of suggestion tool can help you understand what people are searching for around your topics. For example, bloggers might use a tool like this to brainstorm blog post titles that’ll do well in search.

Again, all the free version does for you is generate other keyword suggestions in alphabetical order — it doesn’t tell you anything about search volume or cost-per-click (CPC). To get that information, you’ll have to upgrade to Keyword Tool Pro. The Pro version will also let you export the keywords and use them for content creation, search engine optimization, CPC/PPC, or other marketing activities.

Paid Keyword Research Tools

4) Term Explorer

Price: $34/mo. for Basic; $97/mo. for Pro; $499/mo. for Agency

Term Explorer offers probably the deepest research reports of any keyword research tool on the market. From one single seed term, you can get over 10,000 keyword variations.

Best of all, the tool does a great job of keeping the results as relevant as possible and pulling through lots of supporting metrics with them.

It’ll give you data for all the results on page one of search engine results pages (SERPs), including the number of results, link strength, trust score, and keyword difficulty. To help you get a handle on your competitors, you can use the tool to research domain age, page ranking, and links, as well as the word count, page rank, links, outbound links, and the number of keyword occurrences in title, URL, and headers for individual webpages. You can also export all this data into a CSV for your own analysis.

term-explorer-keyword-expansion.png

Image Credit: Term Explorer

Note: If you only plan on using it a few times a day, there is actually a free version of this tool that’ll do five tiny keyword jobs and five keyword analyses per day, with no queue priority.

5) Moz’s Keyword Difficulty Tool

Price: $99/mo. for Standard; $149/mo. for Medium; $249/mo. for Large; $599/mo. for Premium

The keyword difficulty tool from Moz is one of the most useful components of their paid suite. It’s a fantastic resource for analyzing the competitiveness of a keyword and for unearthing low-hanging fruit.

When you input a keyword into this tool, it’ll find the top 10 rankings for that keyword. Then, it’ll assign that keyword a “Difficulty Score” based on the pages that currently rank for that word. You can look at search volume data for your keywords, then pull up the SERP to see the top 10 results for each term.

moz-keyword-difficulty-tool.jpg

Image Credit: Moz

Want to do some competitive keyword analysis? You can use the tool to see who else is ranking for your targeted keywords, along with information like each site’s page authority and the number of root domains linking to their page.

You can also export all this data into a CSV for your own analysis.

6) SEMrush

Price: $69.95/mo. for Pro; $149.95/mo. for Guru; $549.95/mo. for Business

SEMrush is a competitive research tool that lets you keep an eye on on your competitors’ keywords to find opportunities to bump them out for a top position in Google’s and Bing’s organic search results. You can compare a number of domains against one another to evaluate the competitive landscape, including their common keywords and positions in Google’s organic, paid, and shopping search results.

Position tracking is kind of like a sophisticated version of Google Trends, letting you see a keyword’s position in SERPs and analyze the history of rises and drops. Their colorful, visual charts are also super helpful for more quickly understanding trends and analyzing results.

sem-rush-keyword-tool-overview.jpg

Image Credit: SEMrush

7) Ahrefs

Price: $99/mo. for Lite; $179/mo. for Standard; $399/mo. for Advanced

Position Explorer is similar to SEMrush, but with some added bonuses — and a much more intuitive design.

For example, the Site Explorer part of the tool will let you find the URL rating and domain rating for any website you put in there, along with number of backlinks, number of referring domains, and social metrics for Google+, Facebook, and Twitter. It’s also great for finding link targets: You can use it to get a quick analysis of a site, and you can also use its extensive index when you want to do a deeper dive.

ahrefs-site-explorer-tools.png

Ahrefs’ user interface is a big plus. It’s not just black-and-white tables filled with numbers; instead, you’ll get colorful, interactive charts of things like number of indexed pages, internal and external backlinks, new vs. lost backlinks — all over time.

ahrefs-new-lost-backlinks.png


Brian Dean, founder of Backlinko, say that Ahrefs is his #1 go-to tool for backlink analysis: “I’ve tested over 25 link analysis tools and none come close to Ahref’s in terms of index size, freshness, and overall usability.”

The Position Explorer part of the tool lets you find keyword opportunities where your competitors are ranking, while also giving you a ton of extra link metrics that help you determine keyword competitiveness. And the Content Explorer lets you browse through the most shared content for any topic.

8) Accuranker

Price: $19.95/mo. for Beginner; $29.95/mo. for Pro 300; $44.95/mo. for Pro 600; $74.95/mo. for Pro 1K

Accuranker is a keyword rank tracking tool with a key differentiator: It’s lightning fast while being extremely precise. So if you’re used to spending hours monitoring the rank progression of your keywords, this’ll end up saving you a ton of time.

Other advantages of this tool? It has built-in proxies to get a quick glance at whose ranking within the SERPs for any given keyword. If you plan to report keyword metrics to your manager or your team, you’ll like its scheduled weekly reports featuresaccuranker-tool.png

It’s also one of the best rank trackers out there that offers highly localized search engine rankings for your keywords. So if you’re marketing your business to an international audience, it’s a great tool for analyzing which pages are ranking in different countries.

Finally, it has integrations available with Google Analytics, Google Search Console, Social Monitoring, and YouTube so you can keep an eye on statistics and estimated search traffic for your keywords straight from your AccuRanker dashboard.

9) HubSpot’s Keywords Tool

Price: $200/mo. for Basic; $800/mo. for Pro; $2,400/mo. for Enterprise; (Free Trial Here)

HubSpot also has its very own Keywords Tool within the software. The Keywords Tool helps you research keywords, identify the best keywords for optimizing your site, and track results from each one. This tracking feature allows you to see which keywords are actually driving traffic and leads, so you can use this information to continue optimizing your keywords over time.

The tool will also show you how your competitors rank for specific keywords, and help you monitor and build high quality inbound links.

(HubSpot customers: You can access the Keyword Tool in HubSpot by clicking here or going to Reports > Keywords.)

hubspot-keyword-tool.gif

Now that you know about all these great tools, get out there and start discovering your best keywords for SEO.

18Apr

How would you can analyse your branding reports from Google Analytics ?

Google Analytics provides some great  reports to work with out of the box, but the ability to customize and build your own reports from scratch is what allows marketers to gain truly valuable insights from the tool.

Not only is this a huge time saver, it’s also a great way to get ideas for reports you might not otherwise think to create. After all, you’ve got access to the templates and systems that some of the best thinkers in analytics use on a day-to-day basis, and you can customize them even further according to your needs!


Reports for Measuring Site Performance & Acquisition Patterns

1. Browser Report

One of the most common money leaks on websites is incompatibility with certain browsers. He suggests creating a custom report showing conversions per browser and segmenting the report by device (mobile, desktop, tablet) so as not to skew your numbers.

Search Engine Watch links to a similar pre-made report in their list of time-saving custom reports. If you’re not selling products on your site you can swap out Revenue and Unique Purchases for conversion and goal value-related metrics. And don’t forget to segment by device!

browser report

2. Visitor Acquisition Efficiency Analysis Report

This report was to organize key methods that reveal the  performance of each stream of traffic to a website. You’ll see total sessions, unique users, new users, goal conversion rate and goal value per session, all organized by source and medium.

3. Customer Behavior Report

The report reveals how behavior varies between new and returning users in terms of overall traffic, conversion patterns and event completion.


customer behavior report

4. Mobile Performance Report

This report is ideal for understanding how well your site is optimized for mobile and where you need to make improvements. For example, the site pictured below has a super-high bounce rate for Android; the site’s developers have got some work to do!

mobile report avinash

The report is part of a bundle of dashboards and reports created by Avinash Kaushik. >> Get it here.

5. Site Diagnostics: Page Timing Report

It instantly provides details about problematic pages that need your attention. You’ll discover which pages are taking extra long to load as well as which have an uncomfortably-high bounce rate.

Rachelle recommends that you switch from the “data” table view to the “comparison” table view in order to compare load time to bounce rate; this allows you to view the bounce rate for each page against the site average.


Reports That Tell You How Your Content is Doing

6. Hours & Days Report

The Hours & Days Report  shows you which day of the week and at what time of the day your website receives the most traffic. If you set a large time span––say a couple of months––you can use this data to guide experiments with blog post times.


hour day report dan barker


7.  Referring Sites Report

Great for identifying the referring sites that provide the most value. It tells you not only which referring sites are generating the most traffic but also how they’re contributing to goal conversions.

8. Content Efficiency Report

This report to focus on key metrics that will help you identify which pages are performing the best and which need a little optimization. It’s especially useful for sites that produce a lot of content; as, it can help marketers answer important questions like:

  • Which content is most engaging?
  • Which subject matter experts should we hire more of?
  • What type of content (videos, demos, pictures, reviews etc.) do visitors value more?
  • Which content delivers business or non-profit value?


content analysis report avinash


9. Traffic Acquisition from Social Media Report

This report shows you not only which social media channels are driving the most traffic to your site but also whether or not that traffic is translating into tangible results for your business. Metrics like Goal Conversion Rate and Goal Value will tell you which social media sites you should pay more attention to.

Reports for SEO

10. SEO: Referring Pages Report

This one comes with the Google Analytics starter bundle, and it’s a great way to gauge the effectiveness of your link building efforts and track the top referring links to your website. The “Referral Path” column will tell you exactly which page your links are coming from (not just which website). Bounce Rate and Avg. Session Duration will indicate which links are high-quality, and Per Session Value will tell you which links are generating real business resultsseo refferal report

The Google Organic Insights Custom Report provides insights for your “(not provided)” keywords. Showing the landing page URLs along with their page titles gives you a sense of the general keyword themes that people are searching for on Google before arriving at your site.


12. Keyword Analysis Report

This report, which I found via Econsultancy, lists your most popular keywords (excluding the ones encrypted by Google, of course) alongside visitor metrics, conversion rates, goal completions and page load time for each one. There’s also a tab measuring engagement for each keyword, which is interesting for content marketers, and a tab showing revenue metrics.


Wrapping it Up

Installing these Custom Reports templates and then personalizing them even further according to your needs will save you time and most likely reveal insights about your data that you hadn’t expected. Now I’d like to hear from you: Did I miss any of your favorite Custom Reports? Let me know in the comments below.

10Mar

What you mean by bounce rate? How to improve this?

Bounce Rate in Deep

Before we search for our bounce rate, we have to fully understand what bounce rate is. Bounce rate is the percentage of visitors who come to your website and leave without viewing any other pages on your website. If you look on the statics in Google Analytics, you will see a percentage. If you have average bounce rate, for example, is 75%, this means that 75% of the people who come to your website leave after only viewing the page they entered on, whether it was your homepage or an internal page.

What this conclude to is the fact that your website isn’t retaining its visitors. People are coming to your site and either finding what they want but not anything else or not finding what they want at all. The key is to make sure that once visitors land on a page, they are drawn to visiting even more pages throughout your site.

That all Begins With Google Analytics

Your first stop in figuring out how to improve your bounce rate is in Google Analytics. When you sign into your Google Analytics profile for your website, you are greeted with an average bounce rate. While you want this to go down, it isn’t the one you really need to look into. Here are some things you can learn from your bounce rate throughout Analytics.